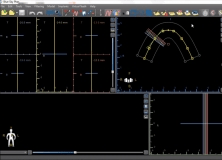
A program for viewing and reformatting images created by computerized tomography
Create Gantt charts in MS Excel.
You can store a data set and perform multiple analyses on it.
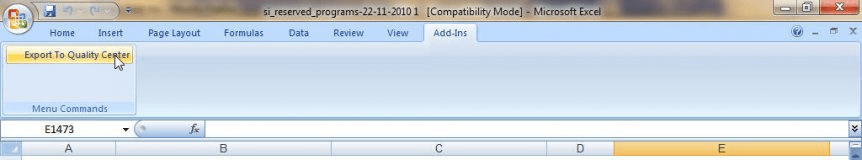
Export your test plan or defects in Microsoft Excel directly to Quality Center.
This transforms your data charts into enjoyable and captivating communication.